Understanding Binary Options
Binary options are financial derivatives that provide a fixed outcome based on a simple proposition: whether the price of an underlying asset will be above or below a specified level at a predetermined expiration time. Unlike traditional trading, where profit or loss depends on how far price moves, binary options offer a predefined payout if the trader’s forecast is correct and a total loss of the invested amount if the forecast is incorrect. This structure makes risk and reward known in advance, which can simplify capital management but also requires consistent accuracy to achieve sustainable results.
Binary options contracts are typically short-term in nature, ranging from seconds to several hours, although longer expirations may be available depending on the platform. The underlying assets can include currency pairs, equities, commodities, and stock indices. Because of the simplified payoff structure, traders must rely heavily on probability, price behavior, and disciplined evaluation of historical performance.
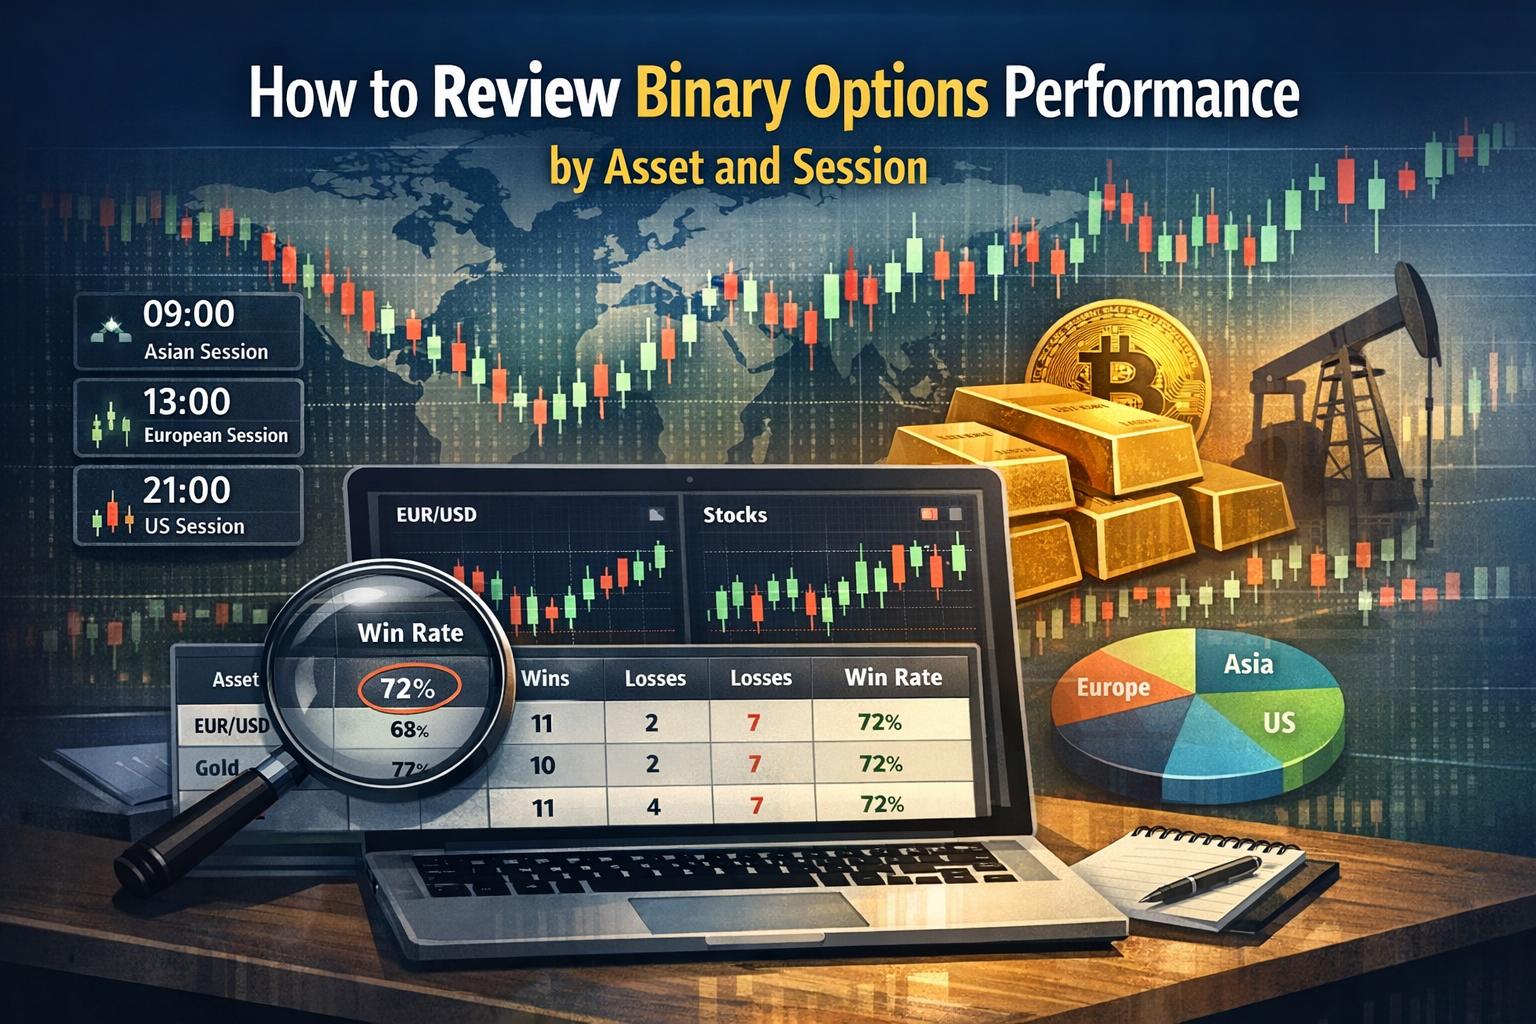
A systematic review of trading performance is necessary for long-term efficiency. Rather than evaluating trades in isolation, traders benefit from reviewing outcomes by grouping them according to asset type and trading session. Breaking down data in this manner allows traders to detect statistical tendencies, eliminate underperforming conditions, and reinforce strategies that produce consistent results.
Analyzing Performance by Asset
Each binary option is tied to a specific underlying instrument. Assets vary in volatility, liquidity, market drivers, and participant behavior. These differences directly affect price movements and therefore impact the probability of a successful prediction.
Evaluating performance by asset begins with structured documentation. Every trade should be recorded with detailed metrics including the date, time, expiration duration, direction chosen (call or put), entry price, expiry price, and final result. When compiled over a large number of trades, this data can reveal asset-specific tendencies.
Tracking Historical Data is the foundation of asset analysis. Traders should maintain consistent records and categorize them by asset class and individual instrument. Over time, patterns may emerge. For instance, a particular currency pair may perform better during trending conditions, while a specific stock might show erratic short-term movement that weakens predictive accuracy. Maintaining clarity and structure in records allows for objective statistical evaluation instead of relying on memory or subjective judgment.
Performance must be measured quantitatively rather than anecdotally. A sufficient sample size is essential. A small number of trades does not provide reliable statistical insight. A broader dataset enables calculation of win rates, average payout ratios, and net returns relative to risk exposure.
Comparing Success Rates across multiple assets allows identification of those with stronger historical predictability under the trader’s strategy. The success rate is calculated as the percentage of profitable trades for a given asset relative to total trades on that asset. However, success rate alone does not determine profitability. Since binary options may offer varying payout percentages, traders must also calculate expected value. Expected value considers both win probability and payout ratio to determine whether a strategy has a positive long-term projection.
In addition to win rates, drawdown metrics should be analyzed. Maximum consecutive losses on a specific asset can indicate risk concentration. If a particular commodity frequently produces long losing streaks, even with moderate overall profitability, capital exposure may need adjustment.
Monitoring Volatility is another critical component of asset-based evaluation. Volatility reflects the degree of price fluctuation within a specific time frame. Assets with higher volatility can create more trading opportunities but also increase unpredictability. Conversely, low-volatility assets may produce stable movements but limited short-term changes. By comparing volatility measures such as average true range or session-based price ranges, traders can align expiration times and entry strategies with the behavior of each asset.
Liquidity is also an influencing factor. Assets with strong liquidity tend to display smoother price transitions and narrower spreads. Stable liquidity conditions can improve execution reliability and reduce abnormal price spikes that may disrupt short-term binary options contracts.
Another consideration is economic sensitivity. Currency pairs react to macroeconomic releases, central bank statements, and geopolitical changes. Commodities may respond to supply data or global production shifts. Equity indices are influenced by corporate earnings and market sentiment. Studying how specific assets react to scheduled economic events can refine timing decisions and reduce exposure during unpredictable news periods.
Segmenting results further by trade type can also reveal asset-specific tendencies. Some assets may respond better to trend-following approaches, while others may generate stronger outcomes when traded with reversal strategies. By correlating asset performance with strategic methodology, traders can refine their focus toward favorable combinations.
Evaluating Performance by Session
Global financial markets operate continuously through overlapping time zones, commonly divided into the Tokyo, London, and New York sessions. Each session exhibits distinct characteristics shaped by regional participation, institutional involvement, and economic reporting schedules.
Analyzing performance by session involves reviewing the same trades used for asset analysis but grouping them based on the time window in which they were executed. Market session dynamics influence liquidity, volatility, and directional bias. Understanding these dynamics allows traders to restrict activity to statistically favorable periods.
Understanding Market Hours is the first step in session evaluation. The Tokyo session is often associated with moderate volatility and narrower ranges in many currency pairs. The London session typically increases market activity due to high participation from European financial institutions. The New York session overlaps partly with London and frequently produces heightened volatility, especially when economic data from the United States is released.
Binary options traders must determine how their chosen assets behave during each session. For instance, currency pairs involving the Japanese yen may exhibit structured behavior during the Tokyo session, while euro-based pairs may be more reactive during London hours. Commodity assets such as gold often experience increased volatility during U.S. trading hours.
Analyzing Trading Volume provides insight into potential price movement stability. Higher trading volume can create stronger directional continuation, while low-volume environments may lead to erratic price fluctuations within narrow ranges. By reviewing average price ranges and win percentages during each session, traders can identify when trades align more consistently with their analytical approach.
Trade timing also affects expiration suitability. Short expirations may perform better in sessions characterized by rapid price movements, while longer expirations could be more appropriate in slower conditions. Evaluating average price displacement during different sessions allows for adjustment of expiration lengths to match observed behavior.
Identifying Session Trends involves reviewing whether certain sessions historically produce directional bias or pattern repetition. Some sessions may regularly generate breakouts following overlap periods, while others may display consolidation before major economic releases. Statistical analysis should focus on repeated measurable behavior instead of sporadic observations.
Session overlap periods deserve particular attention. The London–New York overlap often produces substantial liquidity and volatility. By reviewing historical data, traders may observe changes in win rate or payout consistency during these overlap hours. Concentrating trading activity during statistically favorable overlaps can improve overall efficiency.
External influences such as macroeconomic announcements must also be incorporated into session analysis. Economic calendars help identify periods of irregular volatility. Reviewing how trades performed during high-impact news events compared to regular market hours can clarify whether avoiding or targeting such events is advisable.
Using Tools to Aid Analysis
Accurate performance review requires structured data management and analytical capability. Modern trading platforms often include built-in performance dashboards that summarize trade statistics by instrument and time. However, advanced evaluation may require exporting data to spreadsheet software or specialized statistical programs for deeper breakdown.
Trading Platforms typically allow filtering trades by asset and timeframe. By generating segmented reports, traders can calculate success rates and average returns under different conditions. Customizable metrics such as cumulative profit curves, drawdown charts, and probability distributions support objective interpretation of results.
Additional tools may include charting software that overlays volatility measures, session separators, and volume indicators. These visual aids assist in correlating trade outcomes with prevailing market conditions. When evaluating by session, chart-based visualization often reveals structural behaviors that raw numerical data may not show clearly.
Automated Tools can streamline data processing and reduce manual error. Algorithmic scripts are capable of scanning extensive historical data to detect probabilities tied to specific assets and time periods. While automation can enhance efficiency, the trader remains responsible for validation and interpretation. Over-optimization based on limited samples should be avoided, as it may reduce adaptability to evolving market conditions.
Risk management calculators also support performance refinement. Since binary options present fixed risk per trade, adjusting position sizing based on asset or session reliability can protect capital. If certain sessions yield lower success rates, smaller trade allocation during those periods can stabilize performance.
Data integrity must be maintained carefully. Consistency in recording trade parameters is essential for reliable comparison. Even minor discrepancies in expiration or entry timing can alter outcome interpretation in short-duration contracts.
Integrating Asset and Session Analysis
While asset and session reviews provide value independently, combining both dimensions yields deeper insight. Cross-segment analysis identifies whether specific assets perform unusually well during particular sessions. For example, a currency pair may show average performance overall but deliver significantly improved outcomes during the London session only.
By constructing a performance matrix that categorizes trades by both asset and session, traders can pinpoint statistically favorable intersections. This refined filtering narrows focus toward high-probability scenarios and removes marginal conditions.
Performance integration should include evaluation of trade frequency. An asset-session combination may show strong profitability but limited opportunity. Balancing profitability with frequency ensures sufficient trading volume to sustain overall returns.
Capital allocation strategies can be aligned with integrated findings. Greater funding weight can be assigned to combinations with stable performance metrics and controlled drawdown. Continuous review is required, as market behavior is not static. Periodic reassessment ensures that historical data remains relevant under current conditions.
Maintaining a Structured Review Process
Consistent analysis is necessary for sustained improvement. Traders should establish a regular schedule for reviewing statistics, whether weekly or monthly. Performance reviews should focus on measurable metrics rather than subjective impressions.
Market environments evolve due to economic cycles, regulatory developments, and shifts in global liquidity. Historical patterns may weaken or transform over time. Continuous monitoring helps detect such changes early and prevents prolonged losses under outdated assumptions.
Documenting conclusions from each review cycle creates a reference framework for decision-making. Adjustments to strategy should be incremental and tested against new performance data. Abrupt changes without statistical support can introduce instability.
Effective binary options trading depends less on isolated successful trades and more on structured evaluation of recurring conditions. By systematically grouping performance by asset and session, traders transform individual outcomes into measurable probabilities. This disciplined approach does not eliminate risk, but it enhances clarity, consistency, and informed allocation of capital across varying market environments.
This article was last updated on: June 18, 2026