Understanding Price Action
Price action refers to the movement of an asset’s price over time as displayed on a chart. It reflects the collective behavior of market participants without relying primarily on lagging technical indicators. Traders who focus on price action analyze how price moves, where it hesitates, and where it accelerates. This information is typically presented through candlestick charts, bar charts, or line charts, with candlestick charts being especially popular due to the level of detail they provide regarding opening, closing, high, and low prices within a given time frame.
In binary options trading, where outcomes are determined by whether price reaches a certain level within a fixed time, understanding price behavior is essential. Because trades have predetermined expiry times, identifying high‑probability entry points becomes a central consideration. Price action analysis attempts to interpret shifts in buying and selling pressure in real time. Rather than predicting the future through complex formulas, it focuses on current market structure and observable behavior.
Price action is often associated with simplicity. Traders examine market structure, support and resistance, trend direction, and candlestick formations. Over time, recurring patterns may reveal areas where buyers or sellers consistently take control. These observations form the foundation of many discretionary trading strategies.
The Importance of Price Action Confirmation
Price action confirmation involves waiting for observable evidence that supports a trading idea before entering a position. Instead of placing a trade the moment price approaches a key level, traders look for additional validation through specific candlestick formations or structural shifts that suggest participation from other market actors.
In fast-moving markets, premature entries can result in unfavorable outcomes, especially in instruments such as binary options where timing is critical. Confirmation seeks to reduce the probability of acting on incomplete information. For instance, price may briefly break below a support level only to quickly reverse. Entering immediately on the initial break could lead to a loss if the move turns out to be a false breakout. Waiting for confirmation may help filter out such occurrences.
Why Use Price Action Confirmation?
The primary advantage of confirmation is that it increases alignment with actual market participation. It reduces the likelihood of entering a trade too early, when price has not yet clearly committed to a direction. It strengthens a trader’s hypothesis by requiring observable evidence rather than speculation. It also helps reduce emotional decision-making by establishing predefined conditions that must be met before entry.
Confirmation does not guarantee success. Instead, it shifts the focus from prediction to reaction. Traders respond to what the market demonstrates rather than attempting to anticipate movements without evidence.
Core Elements of Price Action Analysis
Before incorporating confirmation techniques, it is important to understand several structural components that influence price behavior. One of the most fundamental concepts is support and resistance. Support refers to a price level where buying interest has historically prevented further decline. Resistance is a level where selling pressure has previously halted upward movement. These zones are not precise lines but areas where supply and demand interact.
Another essential concept is trend structure. An uptrend is typically defined by a sequence of higher highs and higher lows, while a downtrend consists of lower highs and lower lows. Recognizing whether the market is trending or ranging can influence how confirmation signals are interpreted. For example, reversal patterns may carry more reliability at established support or resistance areas, while continuation signals may be stronger within an established trend.
Market context matters significantly. A candlestick pattern in isolation may have limited value. However, when that same pattern appears at a significant support level during an uptrend pullback, its meaning can change substantially. Confirmation works best when it aligns with broader structural factors.
Incorporating Price Action Confirmation in Your Strategy
When incorporating price action confirmation into binary options strategies, traders often wait for specific chart formations to develop before committing to a trade. These formations attempt to reveal shifts in buyer or seller dominance. Common examples include pin bars, inside bars, and engulfing patterns.
A pin bar typically features a long wick and a relatively small body. The extended wick indicates rejection of a particular price level. For example, a long lower wick near support suggests that sellers initially pushed price downward but were ultimately overpowered by buyers. Traders sometimes interpret this rejection as confirmation that support is holding.
An inside bar forms when the entire price range of one candle is contained within the range of the previous candle. This pattern often represents consolidation or temporary indecision. A breakout from the inside bar’s range may serve as confirmation of directional intent.
An engulfing pattern involves one candle fully covering the body of the preceding candle. This pattern may reflect a significant shift in momentum, particularly when it occurs at a critical price level.
While these formations are visually simple, their effectiveness depends heavily on context. Confirmation gains reliability when patterns align with market structure, overall trend, and clearly defined support or resistance zones.
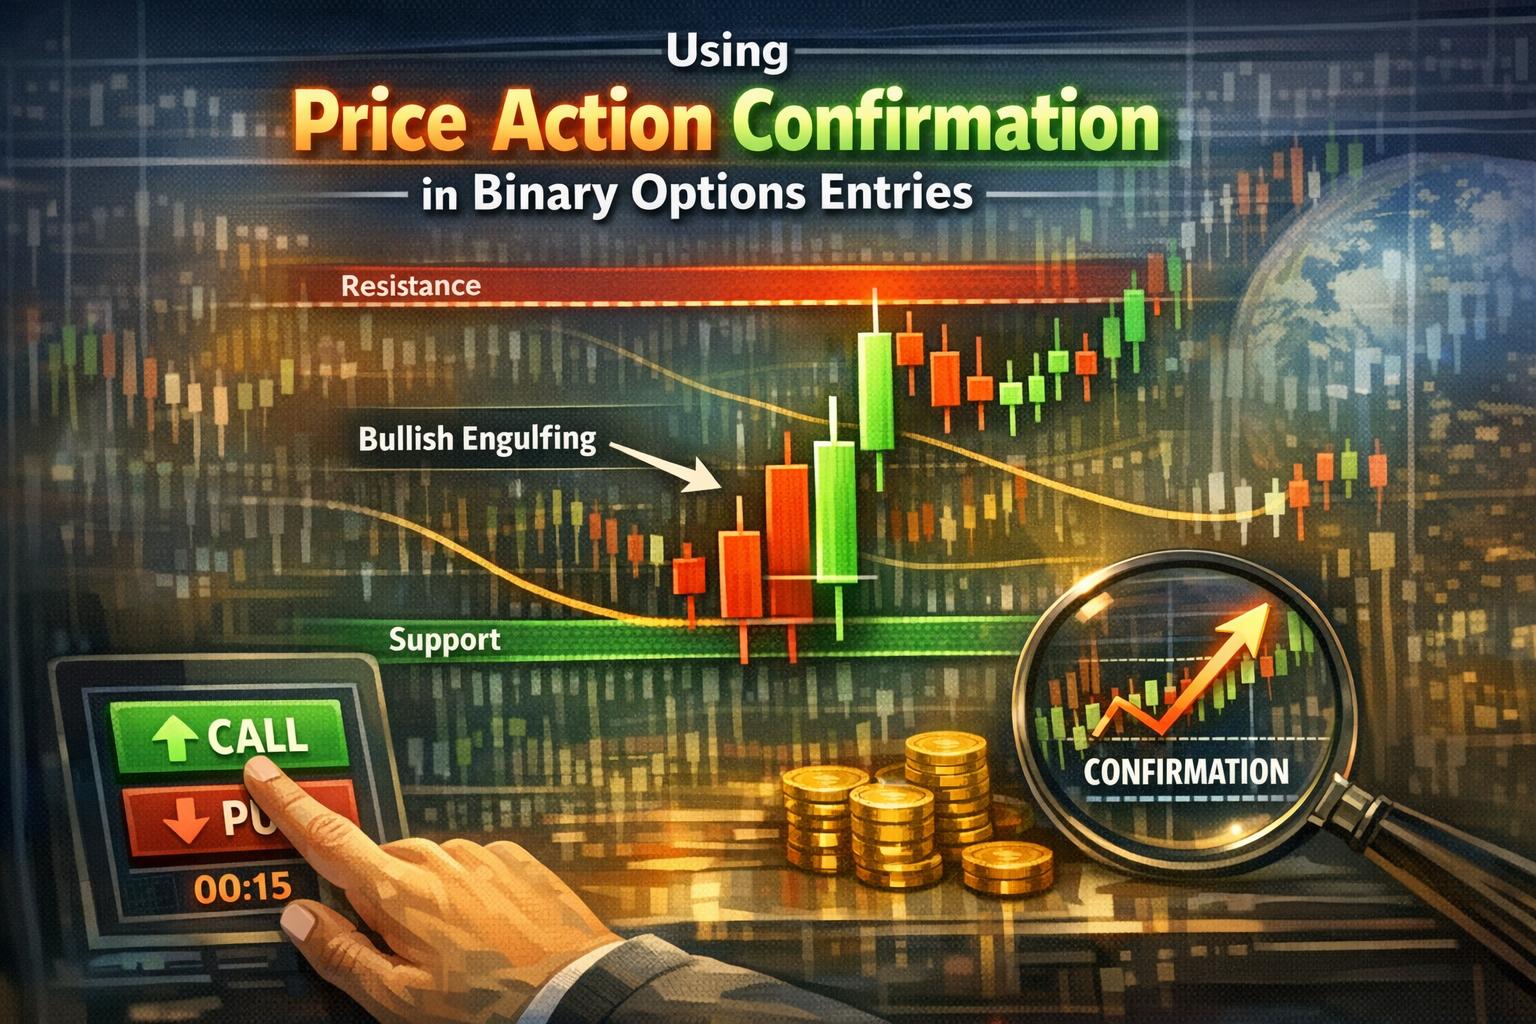
Example – The Engulfing Pattern
The engulfing pattern is commonly interpreted as a potential reversal signal. A bullish engulfing pattern occurs when a small bearish candle is followed by a larger bullish candle that completely covers the prior candle’s body. This formation suggests that buying pressure has overcome prior selling momentum. Conversely, a bearish engulfing pattern emerges when a small bullish candle is followed by a larger bearish candle that engulfs it, indicating increased selling pressure.
In binary options trading, such patterns may be used to determine short-term directional trades. However, relying solely on the shape of the candles can be insufficient. The pattern’s location within the broader market environment plays a decisive role in its interpretation.
Steps to Use Engulfing Pattern for Confirmation
The first step involves identifying context. Traders look for the pattern forming in alignment with a broader market hypothesis. For example, if price approaches a well-established support area within an overall uptrend, a bullish engulfing pattern at that support may reinforce expectations of upward continuation.
The second step is waiting for the close of the engulfing candle. Entering before the candle completes may expose the trade to sudden reversals. Completion confirms that the candle has maintained control through the entire time interval.
The third step includes validating with additional structural or analytical elements. Traders may examine trend lines, observe whether the level coincides with prior swing highs or lows, or consider volume behavior if available. Some may use complementary indicators, but confirmation typically remains rooted in price structure itself.
Through this process, traders aim to participate only when multiple factors align rather than acting on a single visual cue.
Time Frames and Expiry Considerations
In binary options trading, the relationship between chart time frame and option expiry is significant. A confirmation signal observed on a five-minute chart may not be appropriate for an expiry of thirty seconds. Aligning time frames helps ensure that the observed price action has sufficient opportunity to develop within the contract’s duration.
Higher time frames generally produce signals that reflect broader participation, whereas lower time frames may generate more frequent but potentially less stable signals. Some traders use a multi-time-frame approach, identifying overall direction on a higher chart and seeking confirmation on a lower one. This alignment can refine entries while maintaining awareness of larger structural forces.
Risks and Limitations
Although price action confirmation can enhance trading structure, it does not eliminate risk. Market conditions can change rapidly due to economic releases, unexpected news, or shifts in liquidity. Even well-formed patterns at strong levels may fail. In binary options, where outcomes are fixed and timing is strict, delayed or weak follow-through can result in losses despite accurate directional analysis.
Another limitation is subjectivity. Identifying support levels or determining whether a candle truly qualifies as an engulfing pattern can vary among traders. Without consistent criteria, confirmation techniques may become inconsistent.
It is therefore essential to integrate sound risk management practices. Even though binary options have predefined risk per trade, overall capital allocation must be controlled. Position sizing, trade frequency management, and disciplined execution contribute to long-term stability.
Price action should also be understood as part of a broader framework rather than a standalone solution. Market structure, volatility conditions, and macroeconomic context all influence outcomes. Confirmation methods aim to refine timing and probability, not provide certainty.
Consistent documentation and review of trades can support improvement. By recording context, pattern type, time frame, and outcome, traders can assess whether specific confirmation techniques perform effectively under particular conditions.
In summary, price action confirmation represents a structured way to align trading decisions with observable market behavior. By focusing on context, waiting for pattern completion, and integrating confirmation within a comprehensive strategy, traders attempt to improve entry quality and reduce exposure to false signals. While no method guarantees accuracy, disciplined application and awareness of limitations can support a more systematic approach to binary options trading.
This article was last updated on: March 15, 2026